Basic HTML Version


Ecrin v4.12 - Doc v4.12.02 - © KAPPA 1988-2009
Rubis Guided Session #1
• Rub
GS01 - 33/33
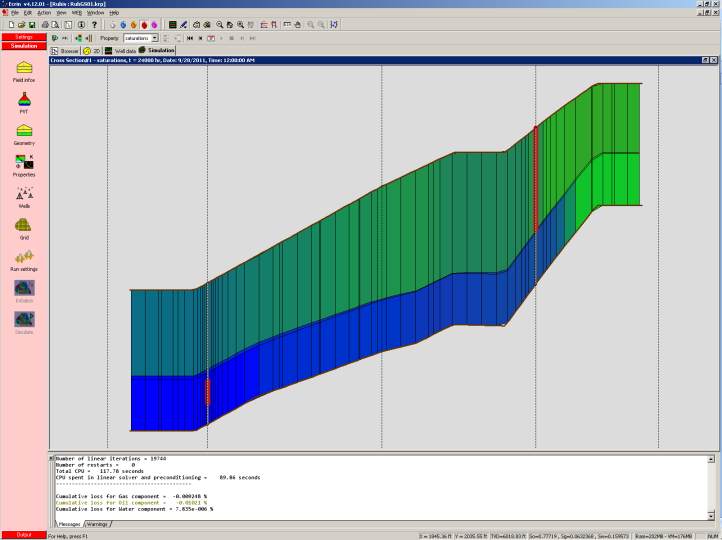
Maximize the cross-section plot, set the display to saturations and replay the simulation using
again. When the animation is complete, move the mouse in the vicinity of the P01 well
(located on the right), in order to read the last saturation values:
Fig. C03.7 • So,Sg and Sw simulated in the vicinity of P01 after 1000 days of production
As can be seen above, some free gas appears by pressure depletion around P01 during the
simulation.