Basic HTML Version


Ecrin v4.12 - Doc v4.12.02 - © KAPPA 1988-2009
Rubis Guided Session #1
• Rub
GS01 - 25/33
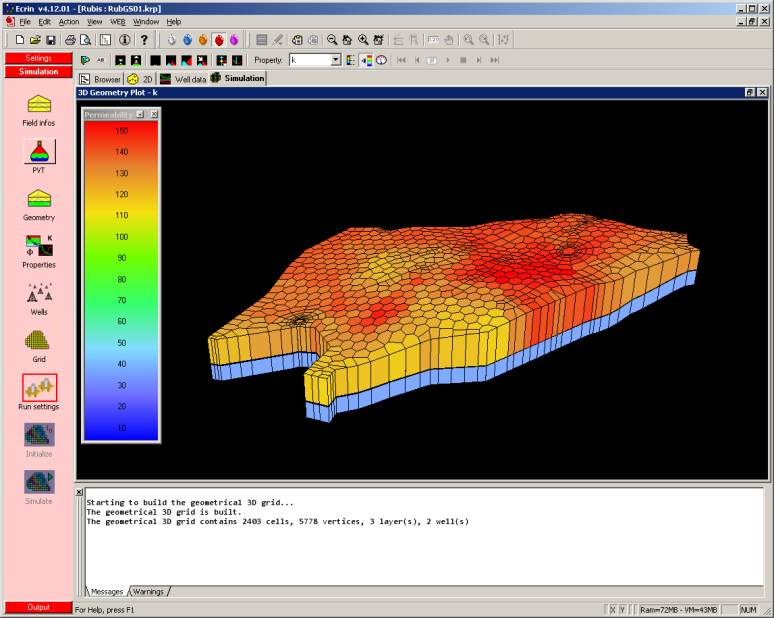
C01.2 • Visualizing the Grid and the Petrophysical Properties
In the 3D Geometry plot toolbar, change the property to be displayed from “No Display” to “k”,
and click on to display the corresponding colorscale:
Fig. C01.5 • Permeability field displayed in the 3D Geometry plot
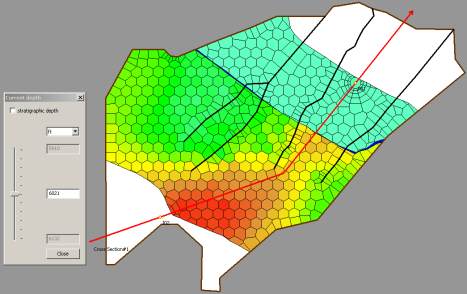
Minimize the 3D plot, and now maximize the 2D Geometry plot instead. Select “Phi” as the
displayed property: the plot will show a horizontal cross-section of the reservoir at a depth
controlled by the Current Depth dialog (called by
) - the color scale of each property may
be edited through the button.
Fig. C01.6 • Porosity field displayed at different depths in the 2D Geometry plot