Basic HTML Version


Ecrin v4.12 - Doc v4.12.02 - © KAPPA 1988-2009
Topaze Guided Session #1
•
TopGS01 - 25/25
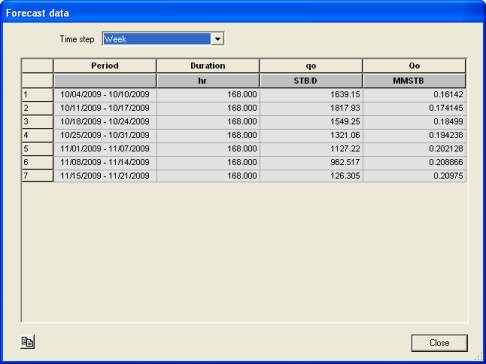
Note that the forecast simulation result can be visualized in a tabular format through the ‘show
forecast data in table' option
available in the history plot toolbar and menu:
Fig. D01.3 • Viewing the forecast simulation result in a tabular format.
Data may be re-sampled (to weekly or monthly average, for instance). Use the option to
export to clipboard.
This concludes the interpretation of this data, with the current model. New analyses could be
created in the same document using the
icon, and results compared.