Basic HTML Version


Ecrin v4.12 - Doc v4.12.02 - © KAPPA 1988-2009
Saphir Guided Session #4
•
SapGS04 - 11/11
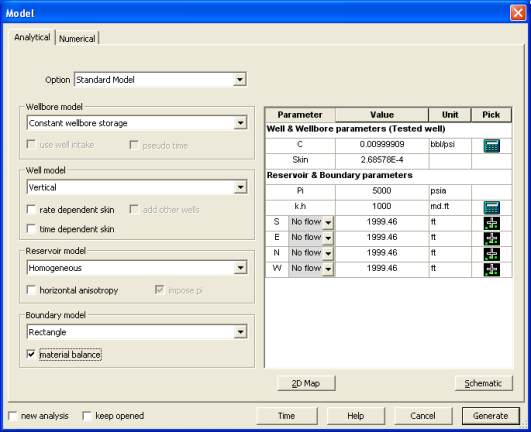
Fig. F01.2 • Model dialog
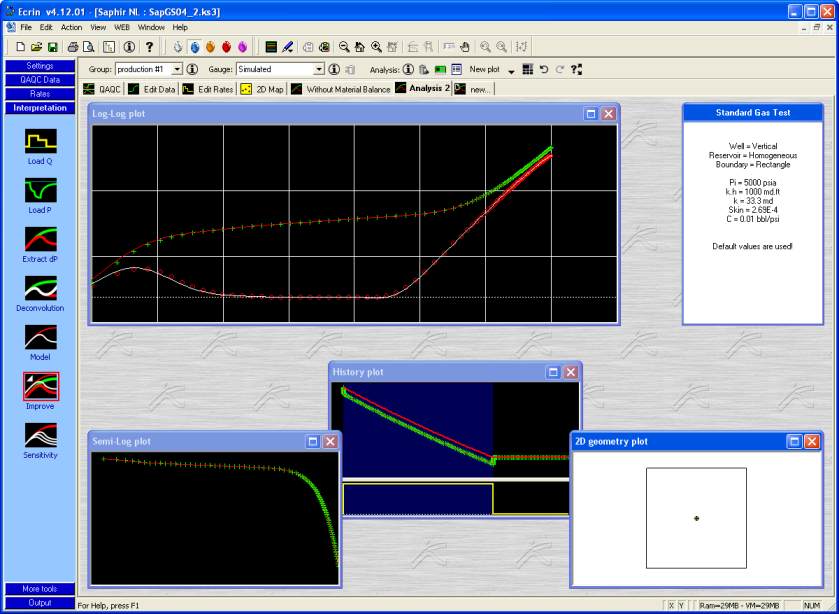
The Saphir screen should now look like Figure F01.3.
Fig. F01.3 • Closed system model with material balance option
Note: the '2D Geometry plot' shown on this screen copy can be enabled in the 'Settings'
control panel, 'Interpretation' icon, 'Misc' tab, by checking the 'Reservoir Geometry' box on.
The analytical model utilizing the 'material balance' calculation option now shows complete
agreement with the simulator results. The history plot also displays a yellow curve that is the
result of the calculated average pressure versus time during the extended production period.