Basic HTML Version


Ecrin v4.12 - Doc v4.12.02 - © KAPPA 1988-2009
Saphir Guided Session #4
•
SapGS04 - 7/11
Select the
panel and then the IPR option through
.
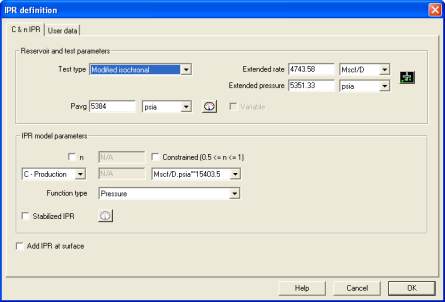
Choose ‘Any well’ and the method C and N.
Select Modified isochronal test and input the value for the average pressure as
5384 psia
.
We will use the pick option to choose the Test points and the extended period. You should not
impose the power of N or any constraints. See Figure D01.1 left.
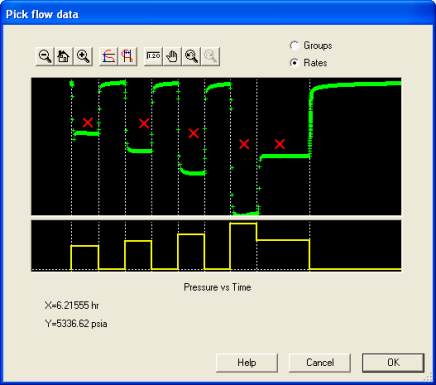
In User data, proceed to pick the Bottom hole pressures, make sure you check the radio
button 'Rates' rather than 'Groups', pick the first four points with the mouse as shown in Figure
D01.1 right. Use the zoom icons to make the selection easier. And then pick the extended rate
before the last build up.
The AOF plot is constructed as seen in Figure D01.2.
Fig. D01.1 • Setting up and picking points for AOF/IPR plot
The yellow line is the extended curve and the red line is the transient rates. The test points
line up perfectly and the results from this analysis is perfectly acceptable with an exponent
well within the allowable range (0.5<n<1).
The plot can also be displayed as the classical IPR curve (bottom hole pressure versus rate) by
clicking the icon in the plot specific toolbar, Figure D01.3.