Basic HTML Version


Ecrin v4.12 - Doc v4.12.02 - © KAPPA 1988-2009
Saphir Guided Session #1
• Sa
pGS01 - 11/12
rate
confirm the previous production time which is calculated within Saphir as the cumulative
G01 • Horner plot
The Horner plot is strictly only valid for a buildup following one single constant
drawdown.
However, when you want to use such an analysis method it is possible, and it is just necessary
to
production divided by the last rate. The access to specialized or flexible plots is through
the page (panel) 'More tools'
.
Click on
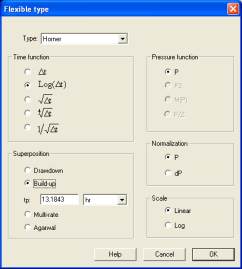
. This will access the Flexible plot dialog, choose the Horner plot in the drop list
(Figure G01.1) and accept the default previous production time.
Fig. G01.1 • Flexible plots
Click OK and the Horner plot is displayed. Right click on the plot and select 'Show Derivative'
and unselect 'Show Model'.
To regress or draw a semilog straight line on the plot use the button
or the plot popup
menu (right click in the plot). Use the regression method
of the line, the line will be displayed and the line results ar
by clicking on
the Results icon
and click the beginning and the end
e accessible
. Figure G01.2.
) can be used as an indication of the best possible straight
line by selecting the interval where the derivative is constant.
The method of drawing a straight-line on the semilog plot in the main Saphir screen is
identical.
The derivative curve (red markers